OpenTelemetry tracing with AWS X-Ray
·NServiceBus version 8 will come with OpenTelemetry instrumentation to capture message processing traces and metrics and export those to any OpenTelemetry compatible tooling.
Some tools like Jaeger or Honeycomb are easy to set up and configure. Others require a bit more effort: AWS X-Ray is one of those. In this post, I’m documenting how to configure a .NET application to send NServiceBus (and any other) OpenTelemetry data to X-Ray in a development environment.
My development environment uses Windows, WSL2, and Docker. Your experience on a different OS might differ (but I expect it to be more straightforward).
NServiceBus OpenTelemetry instrumentation
First, we will use two NServieBus endpoints and configure them to capture distributed tracing data.
I’ll start with the Jaeger sample from NServiceBus and reconfigure it for AWS X-Ray:
- Remove all references to the
OpenTelemetry.Exporter.JaegerNuGet package. - Add references to the
OpenTelemetry.Exporter.OpenTelemetryProtocolandOpenTelemetry.Contrib.Extensions.AWSXRayNuGet packages to thePublisherandSubscriberprojects. - Replace
.AddJaegerExporter()with.AddOtlpExporter(). We’re going to export our trace data using the OpenTelemetry protocol (OTLP). - Directly after
CreateTracerProviderBuilder()add.AddXRayTraceId(). This is required for compatibility with X-Ray and should be configured as the first setting. - In the
.SetResourceBuildersetting, change.AddService(EndpointName)to.AddService("Publisher")or.AddService("Subscriber")respectively. X-Ray doesn’t like resource names with dots apparently, so we need to avoid those.
Ensure to do all those steps for both the Publisher and the Subscriber project. For example, the Publisher endpoint final configuration should look like the following:
Export to X-Ray
Unlike other OpenTelemetry exporters, X-Ray integration happens via a dedicated collector from the AWS Distro for OpenTelemetry (ADOT) project. The .NET application will export OpenTelemetry data via the OpenTelemetry protocol to the ADOT collector, which will ship the collected data to AWS X-Ray.
Let’s get started:
- Make sure to have AWS CLI installed locally. See the installing AWS CLI docs otherwise.
- Make sure your account is correctly configured in the AWS CLI (via
aws configure) by following the configuration documentation. - Configure the necessary IAM permissions so that the ADOT Collector can submit data to X-Ray.
- Create an ADOT Collector configuration file (I’ll name it
collector-config.yaml). Start with this template and change theregionvalues to your default region. - Start the ADOT Collector locally using docker with this command: Start a terminal in the same folder as
collector-config.yaml. To run the following commands, I’m switching to bash (just typebash) since it’s easier to copy & paste the samples from the AWS documentation ;) Make sure to replace theAWS_REGIONvalue with your default region.
docker run --rm -p 4317:4317 -p 55680:55680 -p 8889:8888 \
    -e AWS_REGION=us-west-2 \
    -e AWS_PROFILE=default \
    -v ~/.aws:/root/.aws \
    -v "${PWD}/examples/docker/collector-config.yaml":/otel-local-config.yaml \
    --name awscollector public.ecr.aws/aws-observability/aws-otel-collector:latest \
    --config otel-local-config.yaml;
You should see the following line in the console output (along with plenty of other log statements):
info service/collector.go:128 Everything is ready. Begin running and processing data.
Run the sample
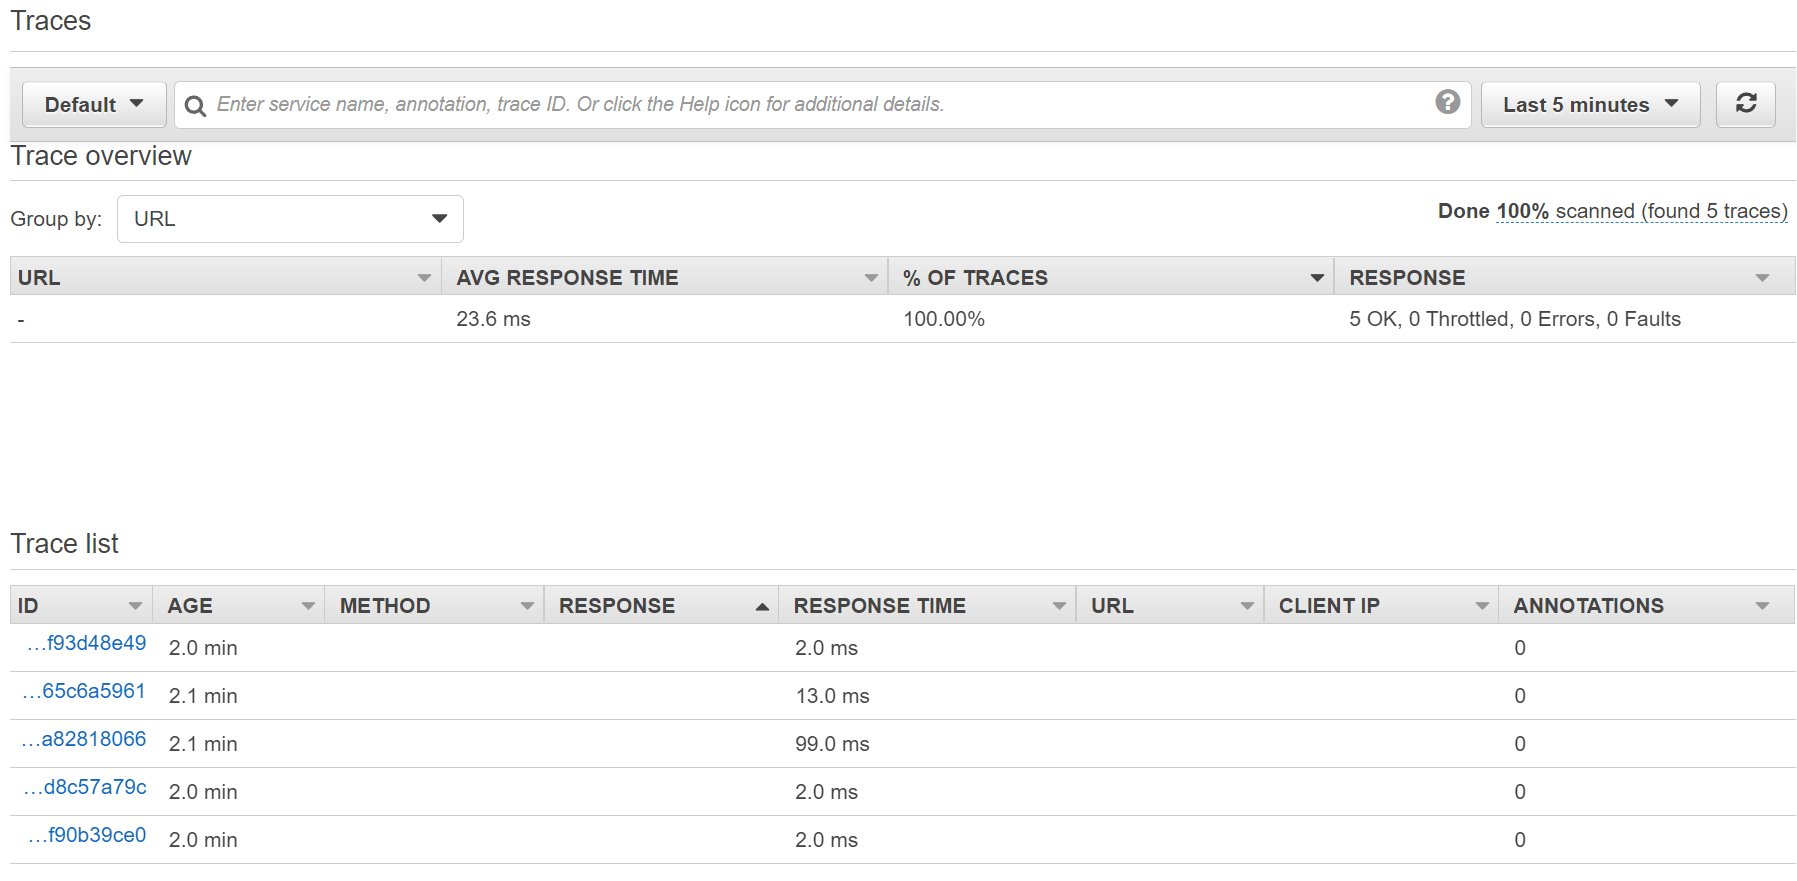
Run the sample app and press [1] on the Publisher endpoint to produce a few messages. If we got our X-Ray instance, we should now see traces being captured:
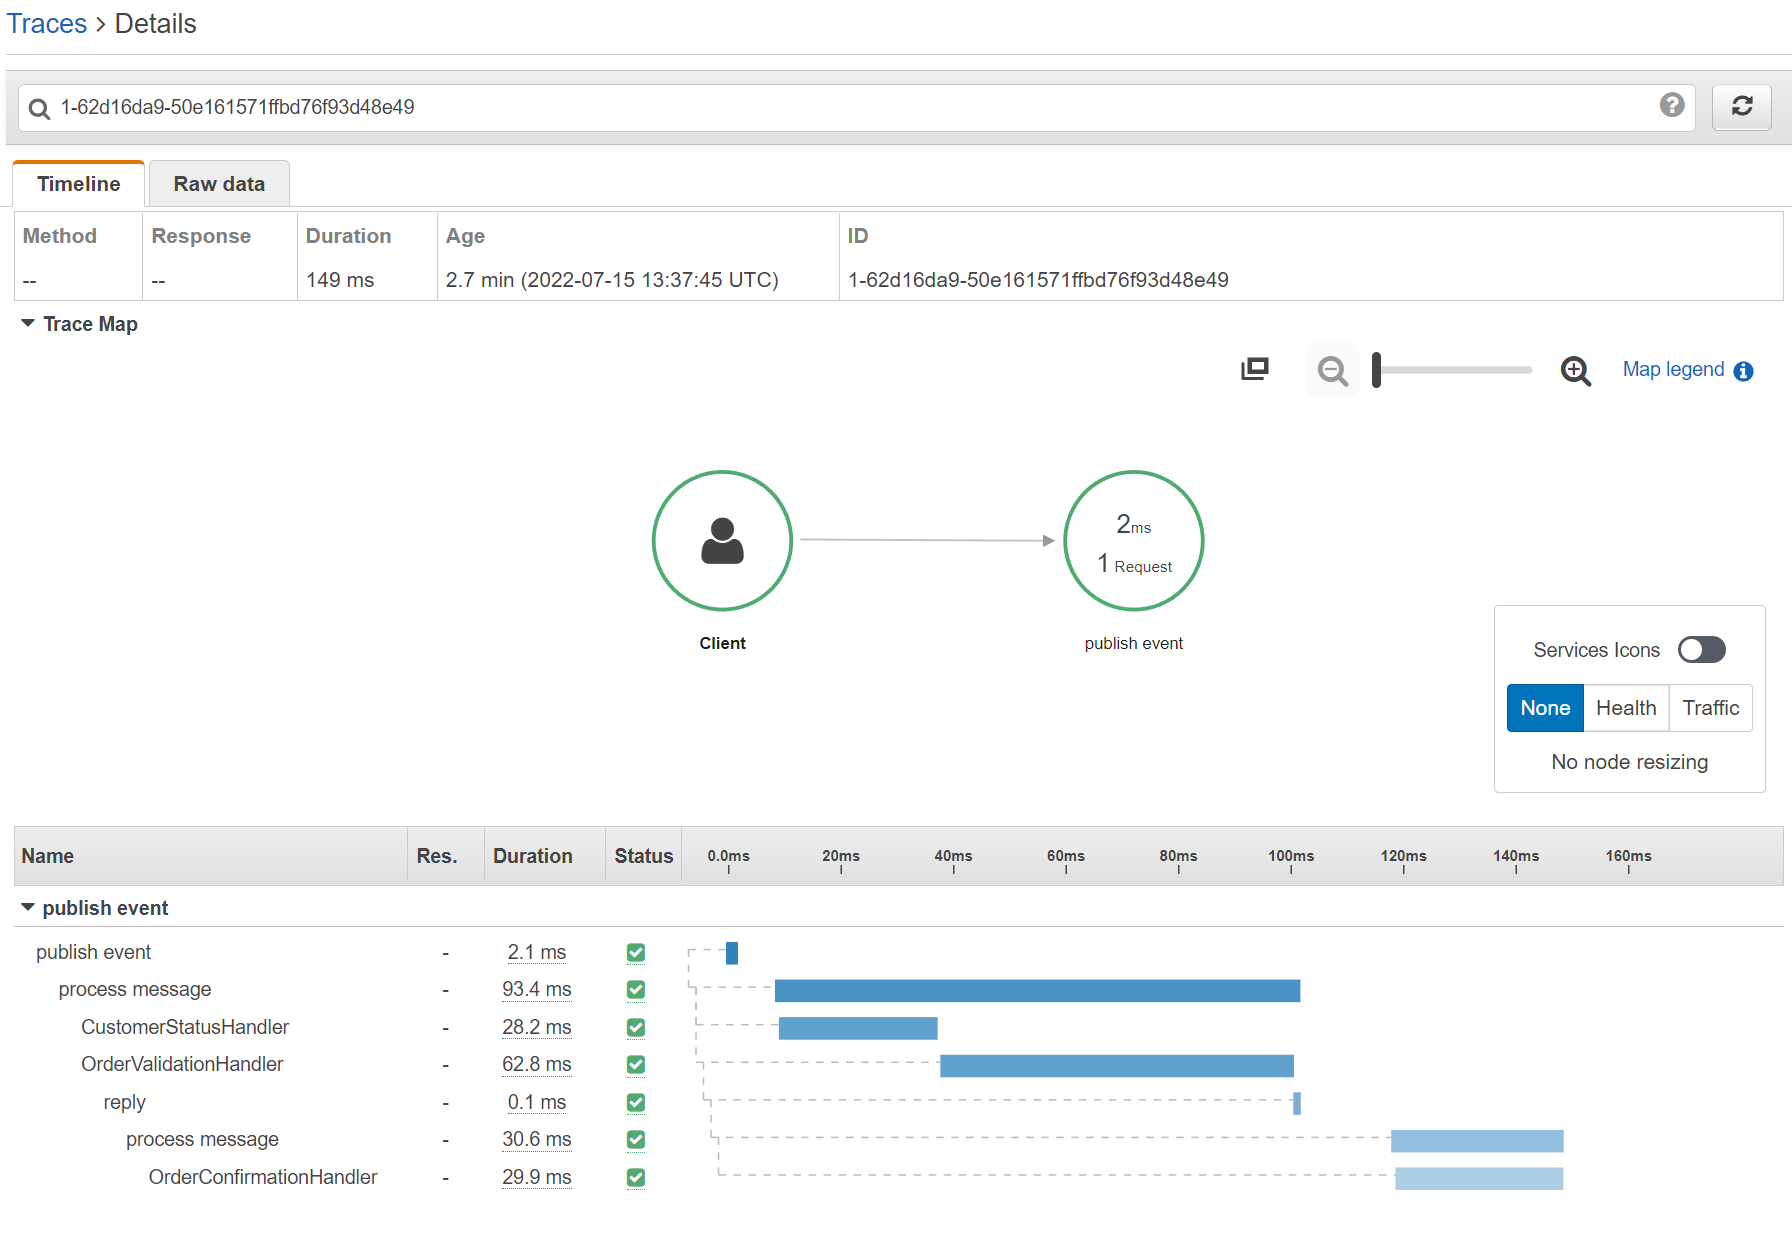
We can drill into a trace by clicking on it to see more details about the message flow of that trace:
Conclusion
Compared to other OpenTelemetry tools, like Jaeger the X-Ray integration requires more effort and the visualization is missing a lot of details. E.g., it is not showing the different endpoints involved in a trace. There is likely further configuration and instrumentation required to use X-Rays capabilities fully, but other tools seem to be a step ahead with OpenTelemetry compatibility.